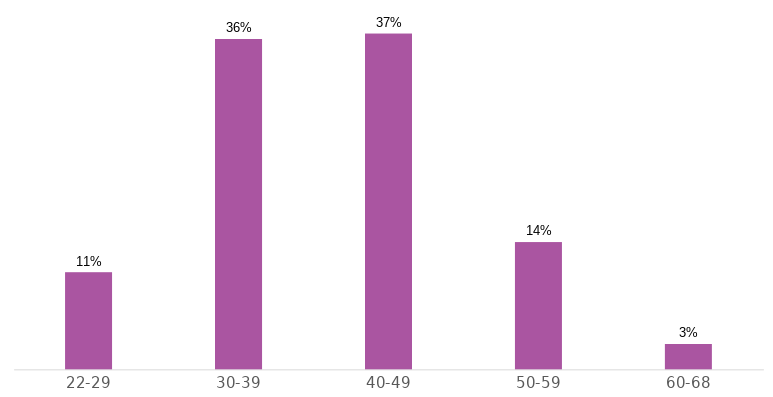
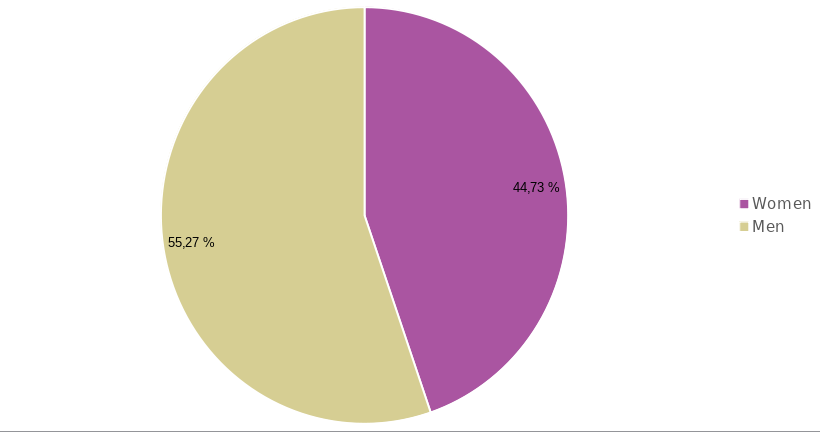
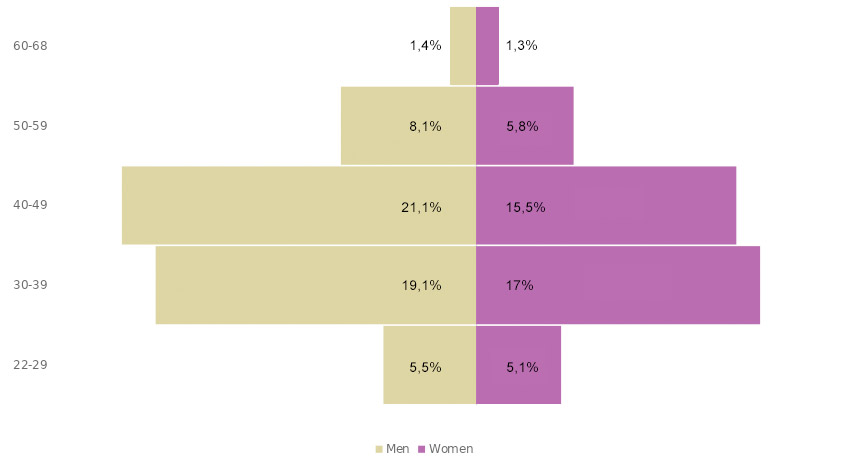
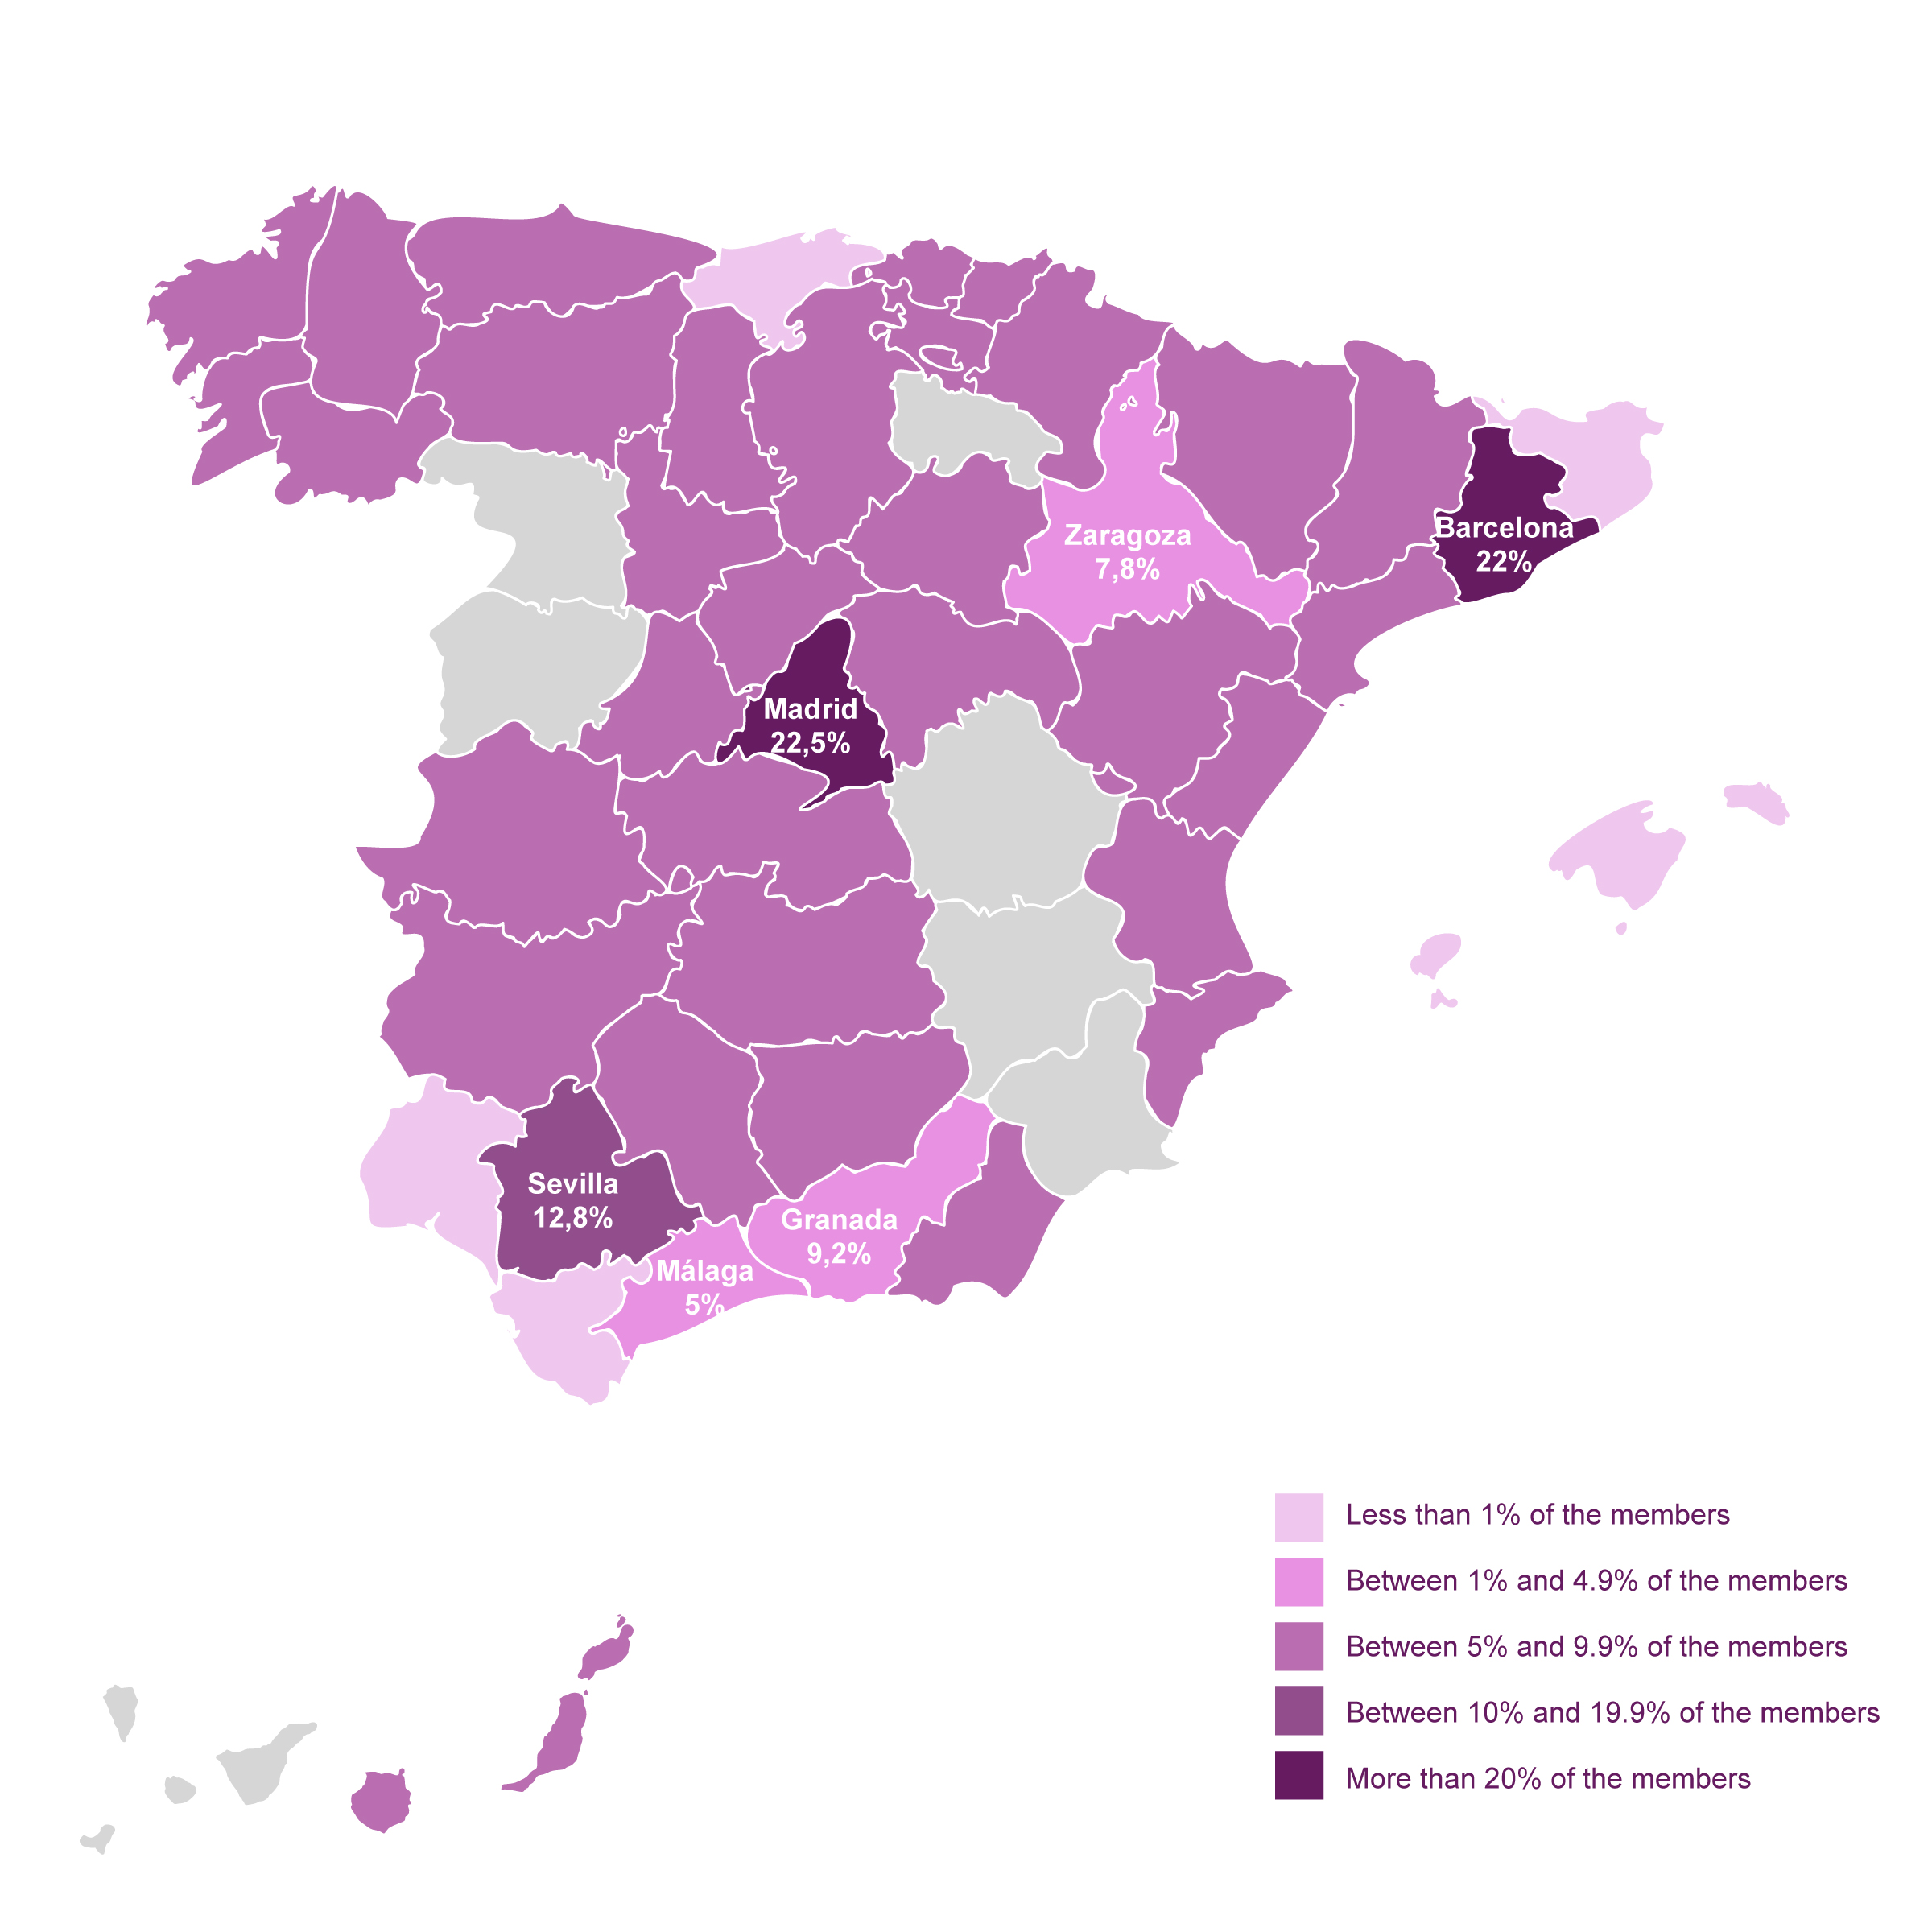
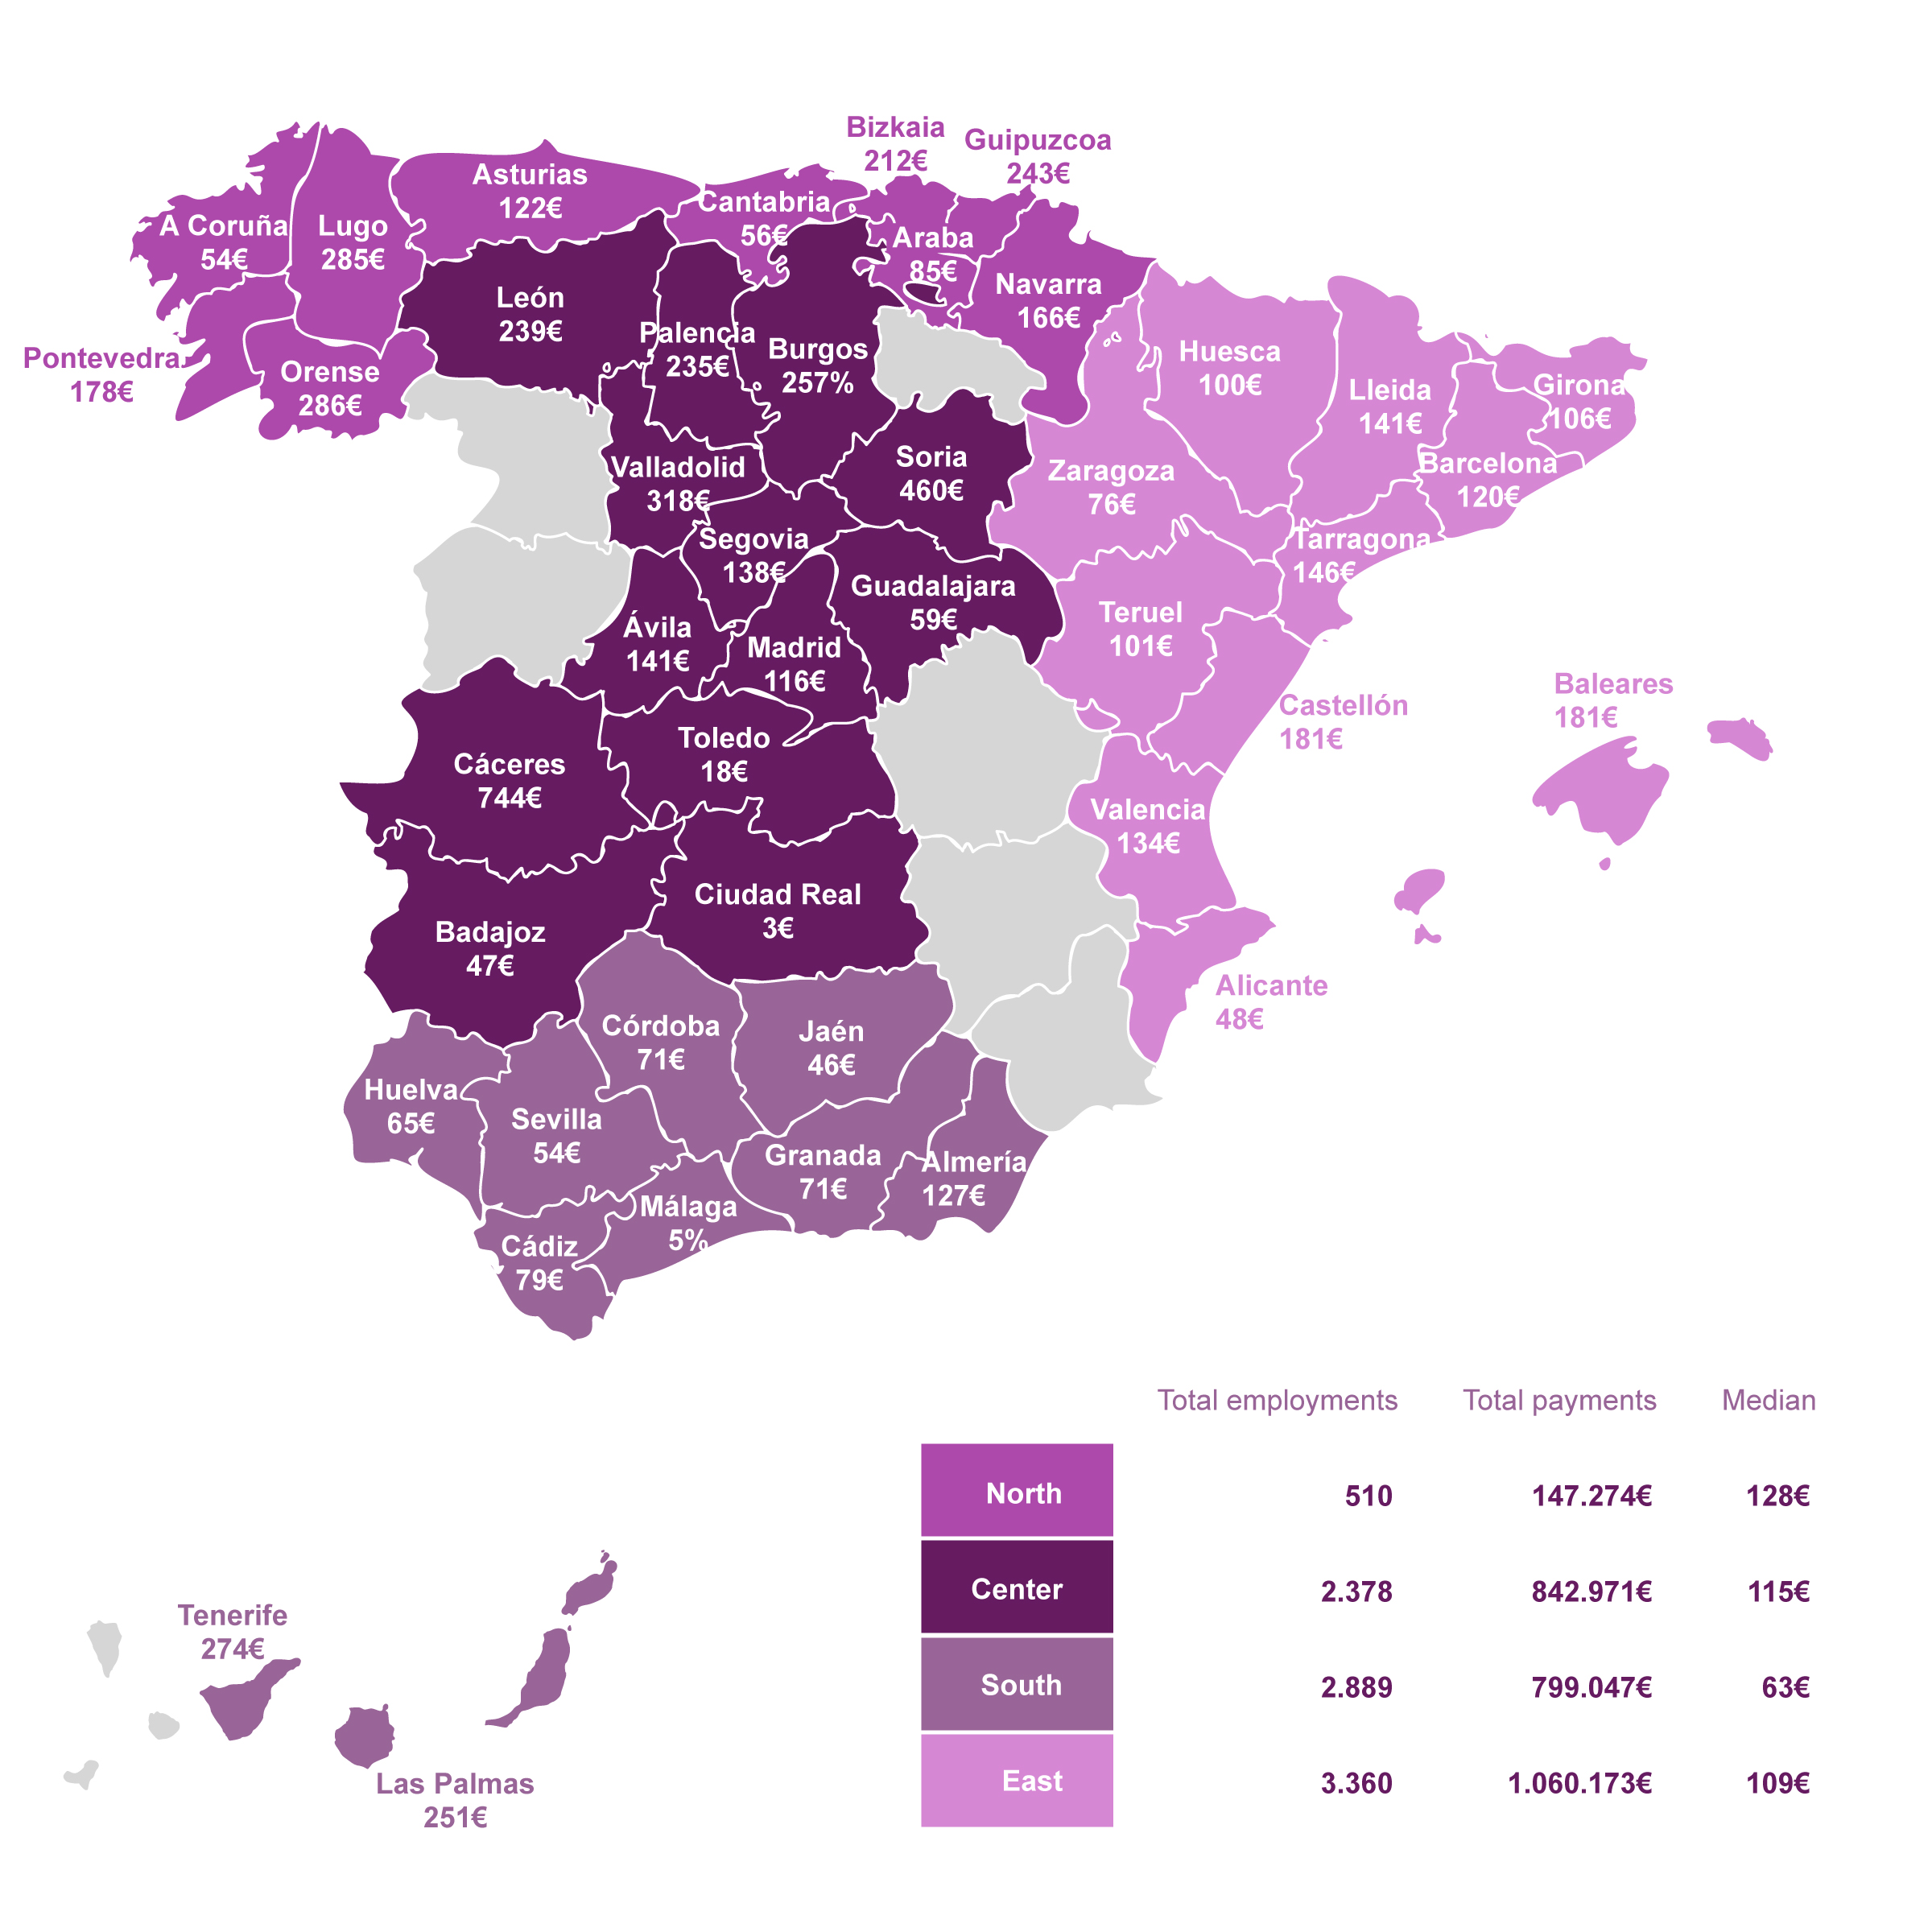
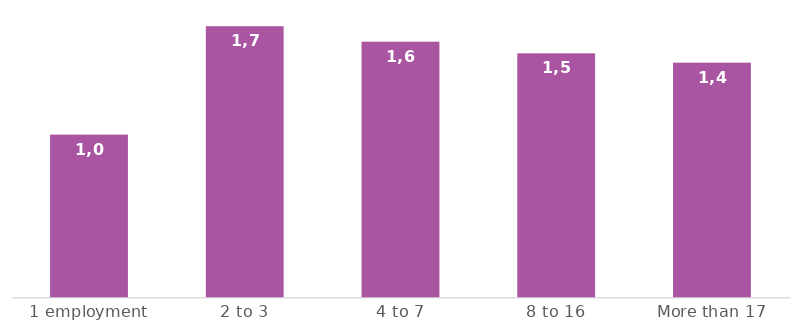
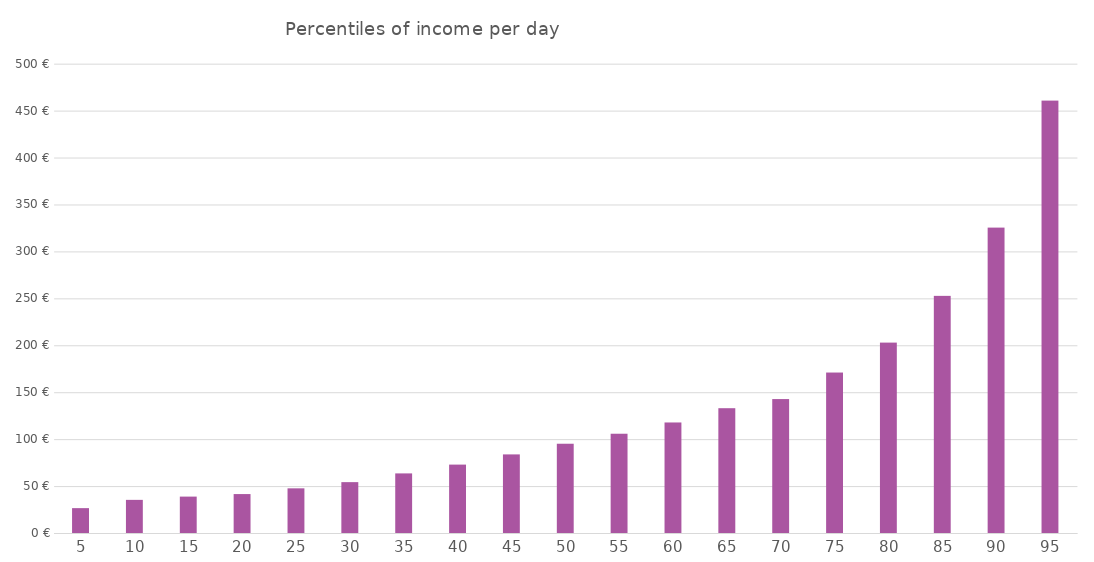
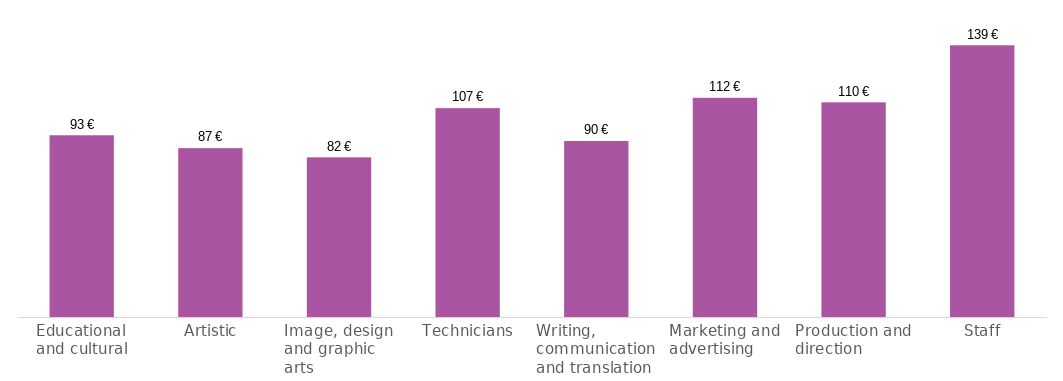
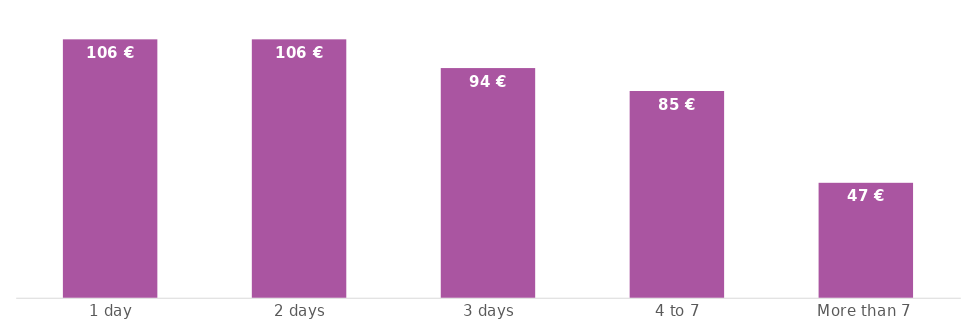
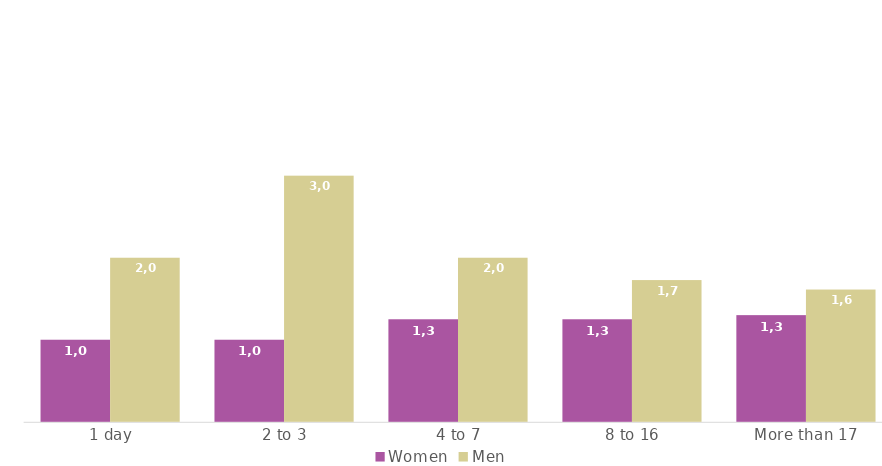
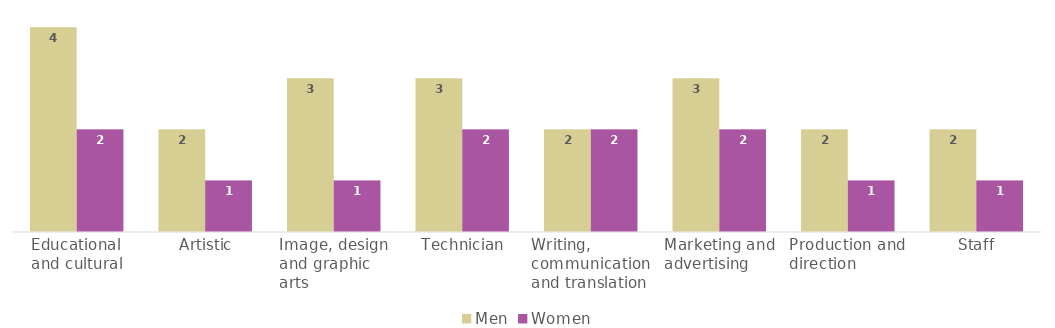
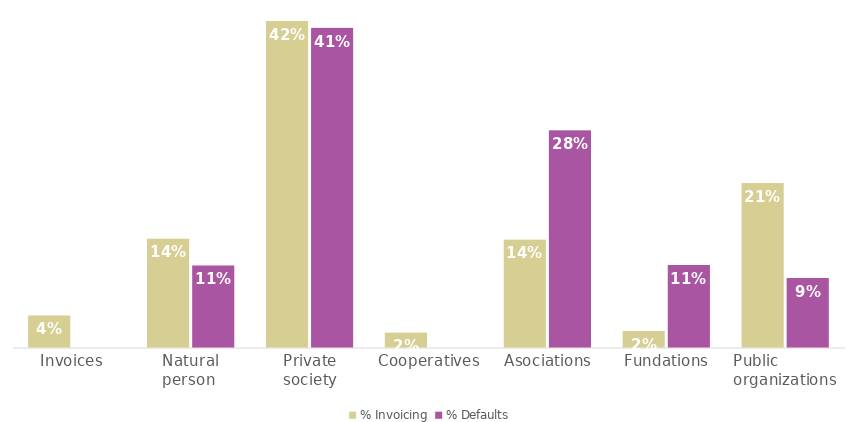
In P2P Models we want to foster a new collaborative platform economy. One of the most precarious sectors in Spain is the cultural sector, which accounts for a significant percentage of GDP (5.8%) and employment (7.8%) but cultural workers and artists only receive about 0.43% of Spanish Public Administration funding, which exposes them to severe inequalities and precarious conditions. In this context, we have chosen a community to research related to this topic, our case study SMART, an invoicing cooperative that helps the creative sector to mutualize services and enable workers to carry out their professional activities within an appropriate legal framework. As a research group we need to better understand the community, therefore, at the end of 2020, we started a collaboration with the research cooperative Indaga which helped us to conduct a quantitative analysis of Smart Iberica based on data we collected in 2019. The main goal of the study was to retrieve data to understand working conditions and possible inequalities looking at three dimensions: Here, we briefly summarise the most important demographic results and suggest possible responses using Blockchain technology. In 2019, SmartIB registered 1339 new members, among which 55% were men and 45% were women. Overall, 70% of SmartIB’s members are between 30 and 49 years old: men being slightly older (most of them are 40-49 years old), and women younger (30-39). 89% of the members have Spanish nationality. Foreign members are mostly from Europe (7%), but also from South America (3%), North America (1%), Africa (0.3%) and finally Asia (0.1%). The distribution of members in Spain reflects the distribution of Smart headquarters: 22.5% of members were in Madrid, 22% in Barcelona and 12.8% in Seville. However, other cities registered a reasonable degree of activity in the cooperative, despite there being no Smart offices in the area, the most active being Granada, Malaga and Zaragoza. Generally speaking, the cities where Smart headquarters are located (Barcelona, Madrid and Seville) are also the areas that register the greatest number of jobs for members. In this sense, there is a difference in the amount of work between big cities and the periphery. After further exploring these geographical differences, we can see that in terms of the average pay received per day worked, the North of Spain registers the highest pay (€128) compared with the Center (€115), the East (€109) and finally the South (€63). This reflects an already known economic disparity between the North and the South of the country. Regarding professional activity, we can see that Smart workers’ conditions as a whole are characterised by a high degree of temporary employment, where half of the registered contracts are for only one day’s work. This has major implications in terms of employment instability, as well as in terms of job security and pay levels. The analysis also showed extreme differences in the duration of contracts, with only 5% of members having contracts of more than 9 days. 99.9% of the jobs were casual, while only 0.1% of the jobs were permanent. This indicates that there is a high degree of casualisation in the sector, not only in terms of the number of jobs, but also in terms of the number of permanent jobs. In this regard, we can conclude that the profile of the users means that Smart’s services are oriented towards this type of temporary employment. Regarding salaries, we spotted a concentration of only a few very high salaries in a small group of workers. According to data, there is in fact a best paid 5% who receive more than €450 per day worked, while 50% receive €100 and the lowest paid 25% receive less than €50 per day worked. In this regard, there is great inequality in the distribution of earnings per working day. This inequality is not only expressed in terms of income, but across all the indicators explored. We have also seen a tendency of centrifugal distribution of income: few workers earn the highest amount yet many workers earn in the lower regions. We found 8 professional categories, which aggregate the set of categories into which SMART members place themselves, to better understand salary differences. These are: Production and Direction; Arts; Technicians; Image, Design and Graphic Arts; Personal services; Marketing and Advertising; Writing, Communication and Translation; Education. The remuneration per day worked shows greater variability between the categories, with the Personal Services category having the highest remuneration and the Image, Design and Graphic Arts family having the lowest remuneration. It was also found that the shorter the duration of the contract, the higher the pay per day worked, but it is the access to jobs of longer duration that defines higher pay in the aggregate over the year. This needs to be discussed in terms of gender equality, since there are several important observations that need to be made. First, as shown in the first section, the profile of members is clearly masculinised. Second, the distribution of contracts according to gender shows an over-representation of women in the group of workers with 17 or more jobs (55% compared to 45%). Also, it is possible to state that women have a greater number of contracts than men per year. However, the accumulation of contracts cannot be interpreted as a factor of better economic conditions, in fact, there is a substantial difference between the contracts of men and women, with the latter experiencing greater temporariness in employment. In this sense, it is possible to conclude that not only is there a higher proportion of short-term contracts among women than among men, but also, for longer-term contracts, men’s contracts are significantly longer than those of women. The wage conditions of SMART members are mainly influenced by their access to longer-term employment, even though the average income per day worked is higher the shorter the duration of the contract. This situation, whereby the ability to access a higher volume of work takes precedence over better pay per day worked in determining the pay conditions of people working in SMART, is particularly clear when comparing the situation of men and women. In this regard, gender pay inequality is expressed as a gap in access to employment while, moreover, men also receive higher incomes than women. Finally, it has been observed that there are more feminized categories, such as Education and Culture or Personal Services, and more masculinized categories, such as Technicians. The latter are also the best paid and with contracts of longer duration. The last part of the report focused on debts and non-payments to the cooperative. The main partners of SMART members’ services are either private companies or public bodies, whereas, in regard to non-payments, it is mostly non-profit associations and foundations that account for the highest volume of non-payments. However, from the graph below, we can also see that the private and public sectors register a high number of non-payments, which reflects a worrying situation for the cultural sector. Finally, the professional categories of Image, Design and Graphic Arts, as well as Technicians, are the most exposed to debts and non-payments, as shown in the graphs below. These data were useful to highlight a situation of high precarity and intermittency in the artistic and cultural work sector. Social inequalities (such as gender, geography and poverty) are reflected in the Smart cooperative, leading us to imagine possible help and solutions from the tech world. Although we are conscious that technology alone cannot solve social problems, we would like to make use of the potentials of data activism in the context of blockchain technology. The main potential of this implementation would be to generate a constantly updated system that would provide members with information about the working conditions experienced in their region, categories and professional families, as well as information about the entities that incur non-payments. This networked knowledge could empower workers when having to define the conditions of their contracts, as well as help to denounce unfair working conditions within certain entities. In this regard, we will soon release a blockchain prototype with the aim of creating a network of cultural workers and collect more data regarding precarity and unfairness in cultural jobs.
SmartIB composition
Working conditions of Smart’s members
Debts and non-payments
Sociodemographic conclusions of the case study and action plans
SHARE
AUTHOR

![]() Authorship is by Silvia Semenzin, but this content has been made by the whole P2PModels team
Authorship is by Silvia Semenzin, but this content has been made by the whole P2PModels team ![]()
![]() Images are by Elena Martínez
Images are by Elena Martínez![]() Copy editing is by Tabitha Whittall
Copy editing is by Tabitha Whittall![]() Rosa Chamorro and Samer Hassan make everything possible
Rosa Chamorro and Samer Hassan make everything possibleYou may also like